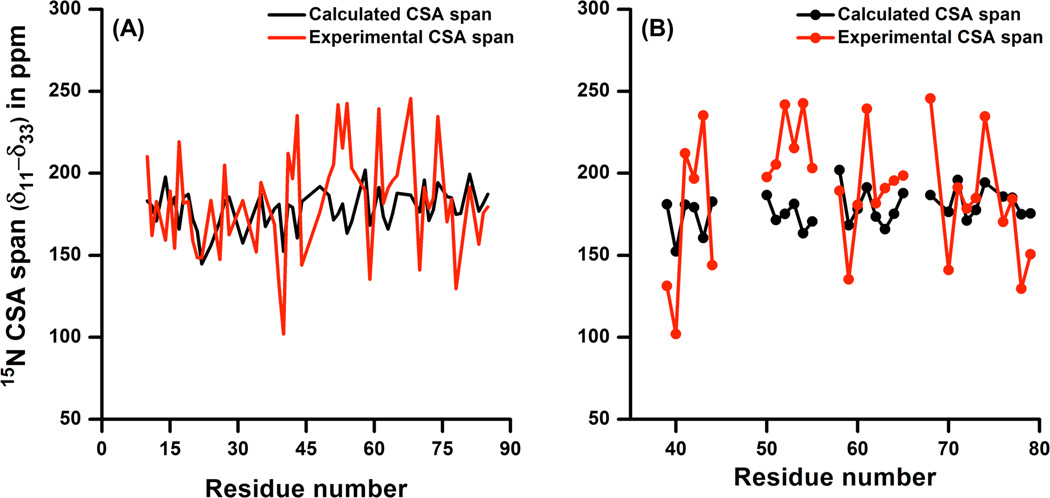
Figure 8. A comparison of experimental and theoretical backbone amide-15N CSA spans determined from solution NMR and Gaussian calculations.
Panel A shows a comparison between computed and experimentally measured backbone amide-15N CSA span. Panel B is the expansion of the region from panel A for residues 39 to 79, which are in close in proximity to the heme of cytb5.

