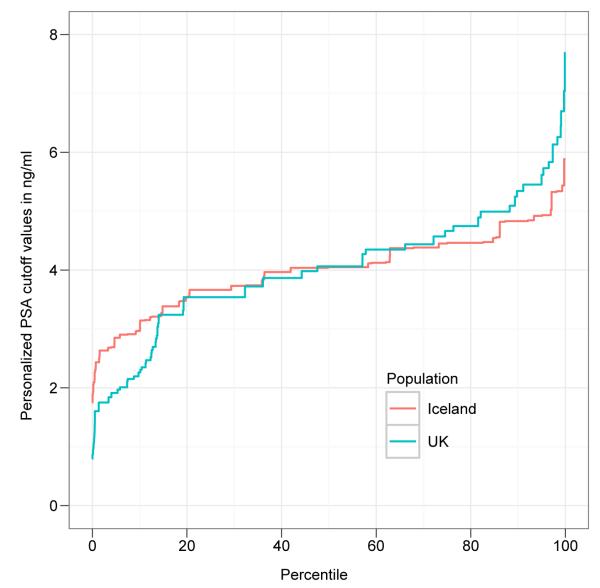
Figure 1. Cumulative distribution of the personalized PSA cutoff values after genetic correction.
Shown is the cumulative distribution (the x-axis represents the percentile of the population) of the personalized PSA cutoff values after applying a genetic correction to the commonly used PSA cutoff value of 4 ng/ml (shown on the y-axis), using the relative genetic estimates for the 4 PSA SNPs (rs2736098, rs10788160, rs11067228, and rs17632542), in the Icelandic (red line) and UK (blue line) study populations.

