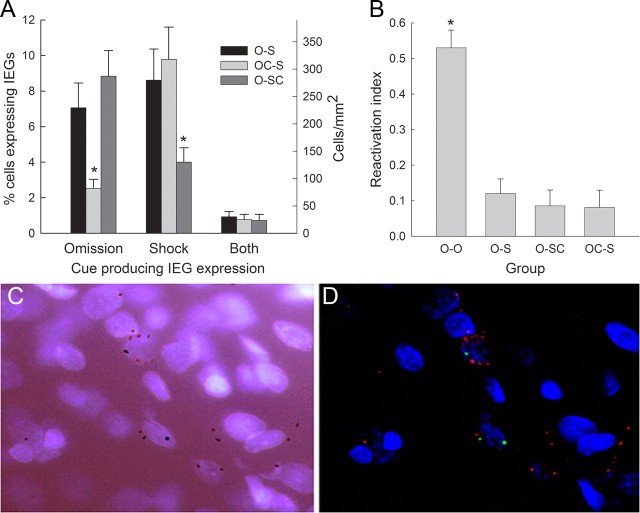
Figure 3.
Arc/Homer1a expression in experiment 1. A shows the percentage (left scale) and numbers of cells per square millimeter (right scale) of CeA neurons that expressed IEGs associated with the presentation of the omission cue alone, the shock cue alone, or both IEGs. Values are collapsed across identity of the IEG (Arc or Homer1a; see Results) and CeA subregions (see Results; Table 2). *p < 0.05, significantly less IEG expression in the control cue conditions than in the omission or shock cue conditions. B shows the reactivation index [double-labeled neurons/(Homer1a only neurons + double-labeled neurons)] for each of the three training groups and the four rats (group O-O) that were tested with the same cue in both epochs of the Arc/Homer1a test. *p < 0.001, significantly higher reactivation index in group O-O (four brains) than in any of the other groups. The group designations indicate the nature of training received. Group O-S (8 brains) received training with both a food omission cue and a shock-paired cue, group OC-S (8 brains) received training with a shock-paired cue and a control cue unpaired with food or food omission, and group O-SC (7 brains) received training with a food-omission cue and a control cue unpaired with shock. C shows fluorescence and D shows confocal images of the same section. Red and green intranuclear foci indicate Arc-expressing and Homer1a-expressing cells, respectively; nuclei are identified by DAPI (blue).

