Figure 3.
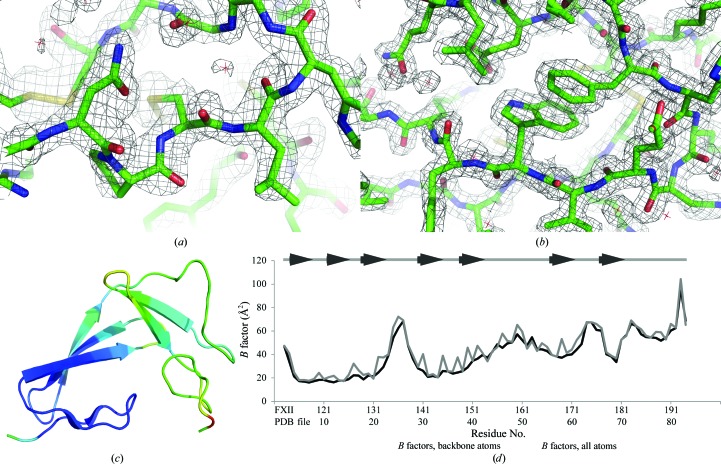
The characteristics of the FXII-FnIE crystal structure. Electron density for the EGF-like domain (a) is less well defined compared with the density for the FnI domain (b) in the |2F o − F c| map contoured at an r.m.s.d. of 1.8. The B factors for the EGF-like domain are higher than those for the FnI domain, as can be seen in (c), where the Cα B factors are shown using a colour range from blue (low B factor) to red (high B factor). The FnI domain is mainly coloured blue, whereas the EGF-like domain is mostly coloured green. The difference in the B factors of the domains can also be seen in the B-factor plot (d). The average B factors of the backbone atoms of the native FXII-FnIE structure are plotted in black and the all-atom average B factors are plotted in grey. The β-sheet residues are depicted as arrows above the B-factor plot.

