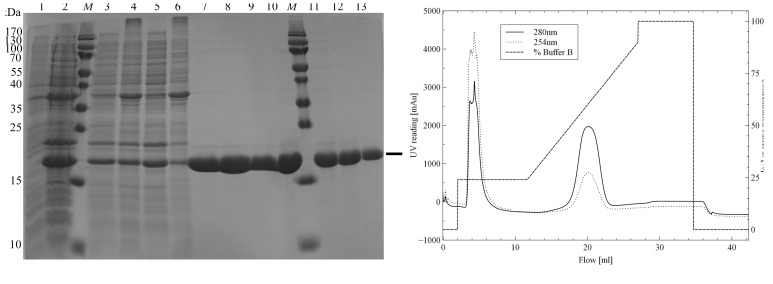
Figure 1.
TraMΔ protein production. (a) SDS–PAGE to assess protein production and purification (TraMΔ, 18.6 kDa). Lanes 1 and 2, expression before and after 3 h IPTG induction; lanes 3 and 5, supernatant of the two-step extraction; lanes 4 and 6, pellet of the two-step extraction; lanes 7–9, main fractions of the His-affinity purification; lane 10, pooled and concentrated His-affinity fractions; lanes 11–13, main size-exclusion chromatography fractions; lane M, molecular-mass marker (PageRuler SM0671, Thermo Fisher Scientific, Waltham, Massachusetts, USA; labelled in kDa). (b) His-affinity purification of TraMΔ. The imidazole gradient is shown as the percentage of buffer B (discontinued line).

