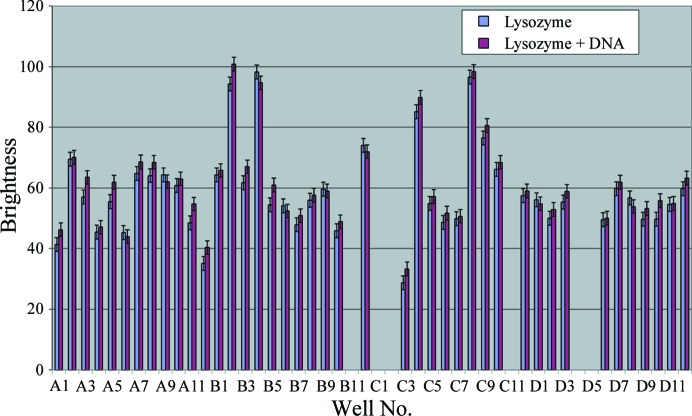
Figure 2.
Intensity of the fluorescence for protein and protein–DNA mixture, where 0 is black and 255 is white (average of ten randomly chosen pixels from within the drop), over 80 homogeneous conditions of JCSG+. Missing values were not measured owing to an uneven brightness within the drop, for example B11, visible in Fig. 1 ▶. The average is 58.76, with a standard deviation of 14.77.

