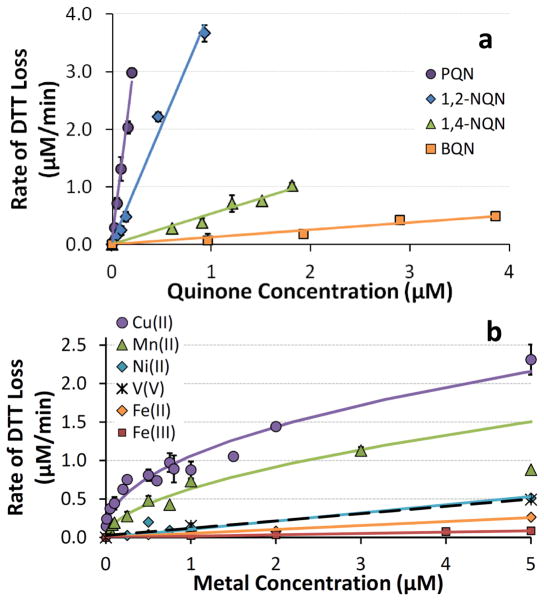
Fig. 4.
Blank-corrected rates of DTT loss as a function of concentration of redox-active species. (a) shows results for the four quinones that oxidized DTT, while (b) shows results for the six DTT-reactive metals. Each point represents the average (± σ ) of multiple individual rate determinations. Lines represent regression fits to the experimental data; the corresponding equations are listed in Table 1. The regression for Mn(II) does not include the 5.0 μM point.

