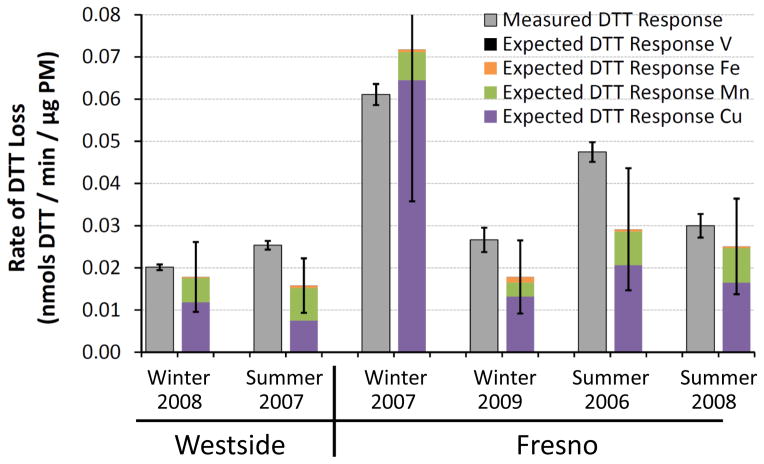
Fig. 6.
Measured rates of DTT loss from ambient PM2.5 collected from the San Joaquin Valley of California. For each sample the left gray bar represents the rate of DTT loss measured for the particles (average ± 1 σ, n = 2 to 4 for each sample), while the right colored bar represents the expected rate of DTT loss from metals based on measured metal concentrations in each sample (Shen et al., 2011) and our DTT response for each metal (Table 1). Error bars for the expected DTT responses represent 1 σ, propagated from uncertainties in each metal concentration.

