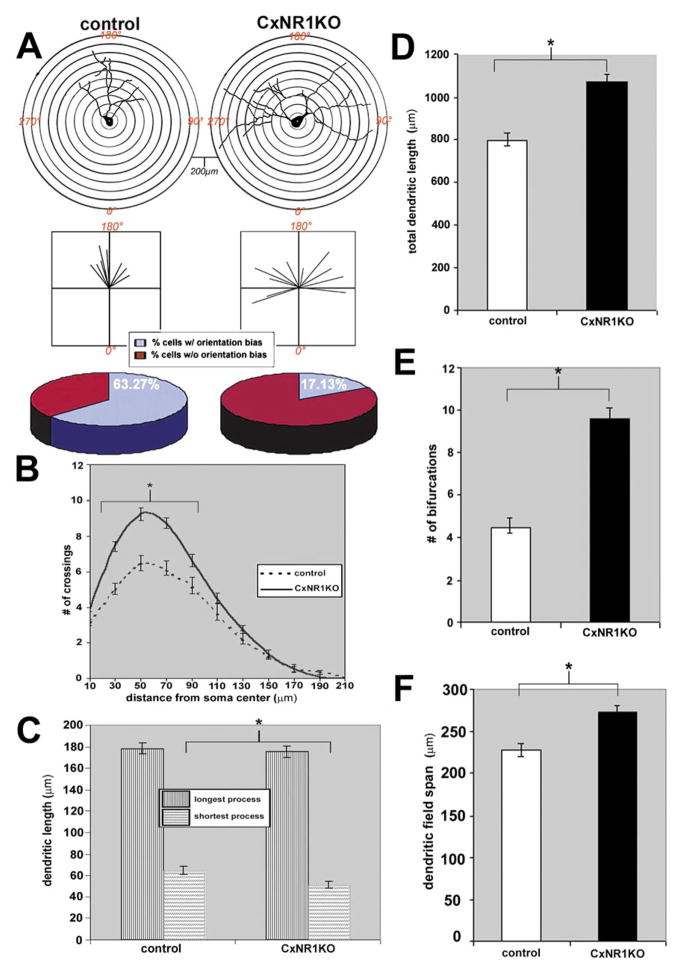
FIG. 6.
Quantification of dendritic parameters of spiny stellate cells in the CxNR1KO and control S1 cortex. (A) Top panel illustrates the Scholl ring analysis used to determine orientation bias of charted layer IV cells and their dendritic arbors; below are vector plots of the same cells and the pie charts indicate the relative percentage of cells scored as having an orientation bias in both control and CxNR1KO mice. B–F are graphs comparing control and CxNR1KO dendritic parameters; B illustrates the number of crossings as a function of distance from the soma P < 0.0019 for soma distances between 30 and 100 μm. (C) The mean lengths for the longest and shortest dendritic process P < 0.007 significant for the shortest process only; D compares the total dendritic length P < 0.001; E the number of bifurcations P < 0.00001; and F, the dendritic field span P < 0.0009. Error bars = SEM.

