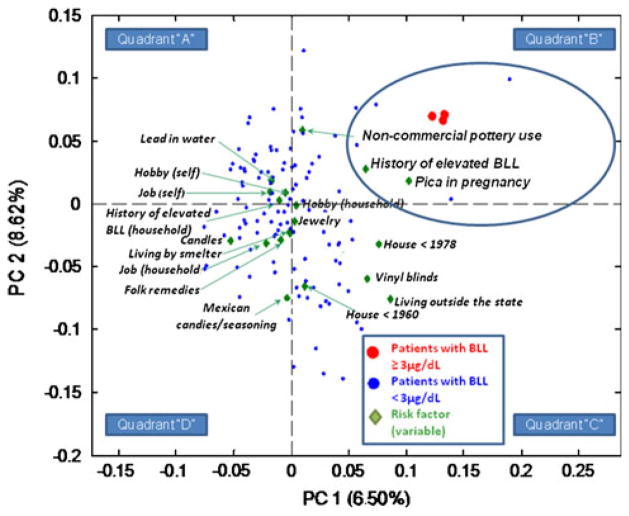
Fig. 3.
Combination of potential sources of lead exposure, organized into principal components, which results in the best separation of subjects with positive and negative BLLs. Note: Correlated risk factors (green diamonds) which best separate patients with ‘positive’ (red dots) and ‘negative’ (blue dots) blood lead tests are located in the same quadrant on a plot. PC 1, first principal components (quadrants “B” and “C” vs. “A” and “D”). PC 2, second principal component (quadrants “A” and “B” vs. “C” and “D”). “Self” and “household” labels refer to risk factors applicable to a pregnant women and a household member, respectively

