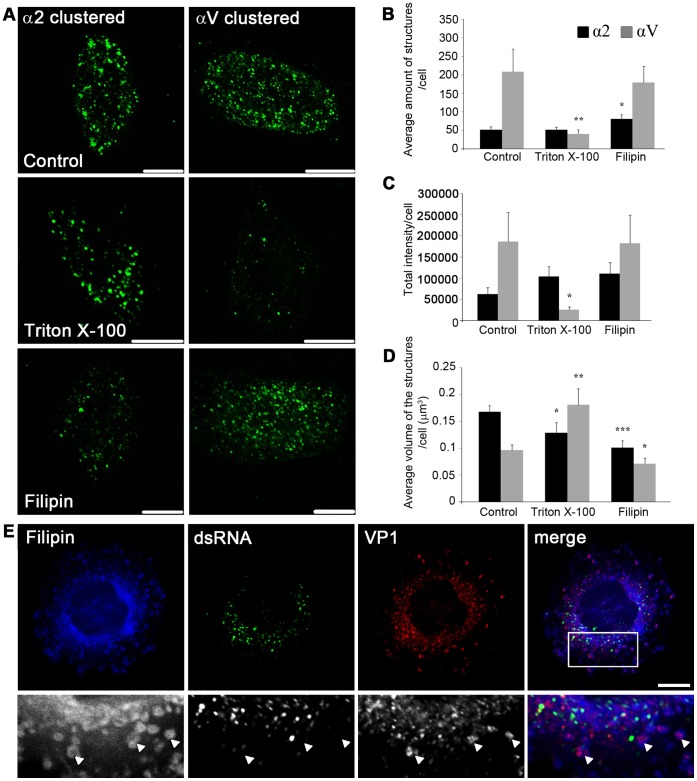
Figure 5. α2 integrin structures contain lipid microdomains.
A) Confocal images of control cells and cells treated with Triton X-100 or filipin 2 h after clustering and internalization. Bars, 10 µm.B) The average amount of structures positive for α2 or αV integrin per cell. C) The sum of average fluorescence intensities of structures positive for α2 or αV integrin. D) The average volume of α2 or αV integrin-positive structures per cell. B–D) The results were quantified with the segmentation tool in the BioImageXD software. ***P<0.005, **P<0.001, *P<0.01. Results are expressed as mean values measured from z-stacks of 15 cells ± SE. E) Representative confocal image of EV1 infected cell at 4 h p.i. labeled with filipin (blue), anti-dsRNA (green) and anti-VP1 (red) antibodies. Illustrative examples of filipin and VP1 colocalizing structures are marked with arrowheads. Bar 10 µm.

