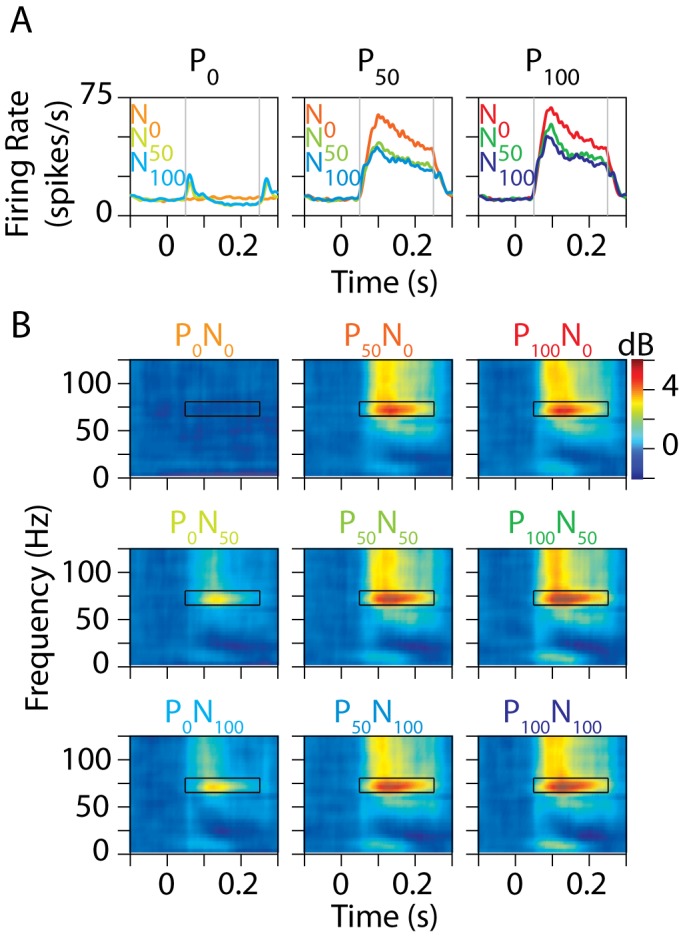
Figure 3. Gamma power depends on normalization.

(A) Average firing rate of 96 MT neurons from two animals when two stimuli—one moving in the preferred direction and the other in the opposite (null) direction—were presented in the receptive field while the monkeys attended to a third stimulus outside the receptive field. The preferred and null stimuli were presented at 0%, 50%, or 100% contrast, yielding nine stimulus configurations. Each plot shows the data for a fixed value of the preferred contrast: 0% (i.e., no preferred stimulus; left panel), 50% (middle), or 100% (right). The different colored lines in each plot each represent a different null contrast: 0% (red; lower preferred contrasts have a lighter shade), 50% (green), or 100% (blue). The stimuli were presented for 200 ms. Firing rates were computed between 50 and 250 ms (gray lines). (B) Time-frequency power difference spectra, which represent the change in power relative to a prestimulus baseline (100 ms immediately before stimulus onset) for the nine stimulus conditions. Gamma rhythm was computed between 50 and 250 ms at 65 and 80 Hz, indicated by a black box in each plot.
