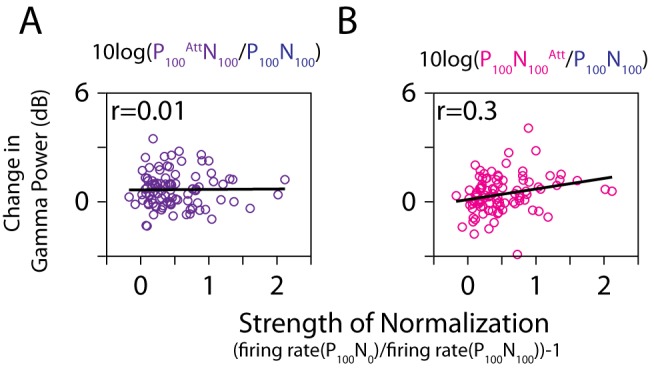
Figure 8. Comparison of normalization and attention on a neuron-to-neuron basis.

(A) For each neuron, the degree of normalization (α), defined as firing rate(P100N0)/firing rate (P100N100)−1 (x-axis), is plotted against the relative change in gamma power when attention is directed to a preferred stimulus versus outside: log10(gamma power(P100 AttN100)/gamma power(P100N100)) (y-axis). The Spearman rank correlation is indicated on the top. The black line indicates the best fit obtained through linear regression. (B) Same analysis when attention is directed to the null stimulus.
