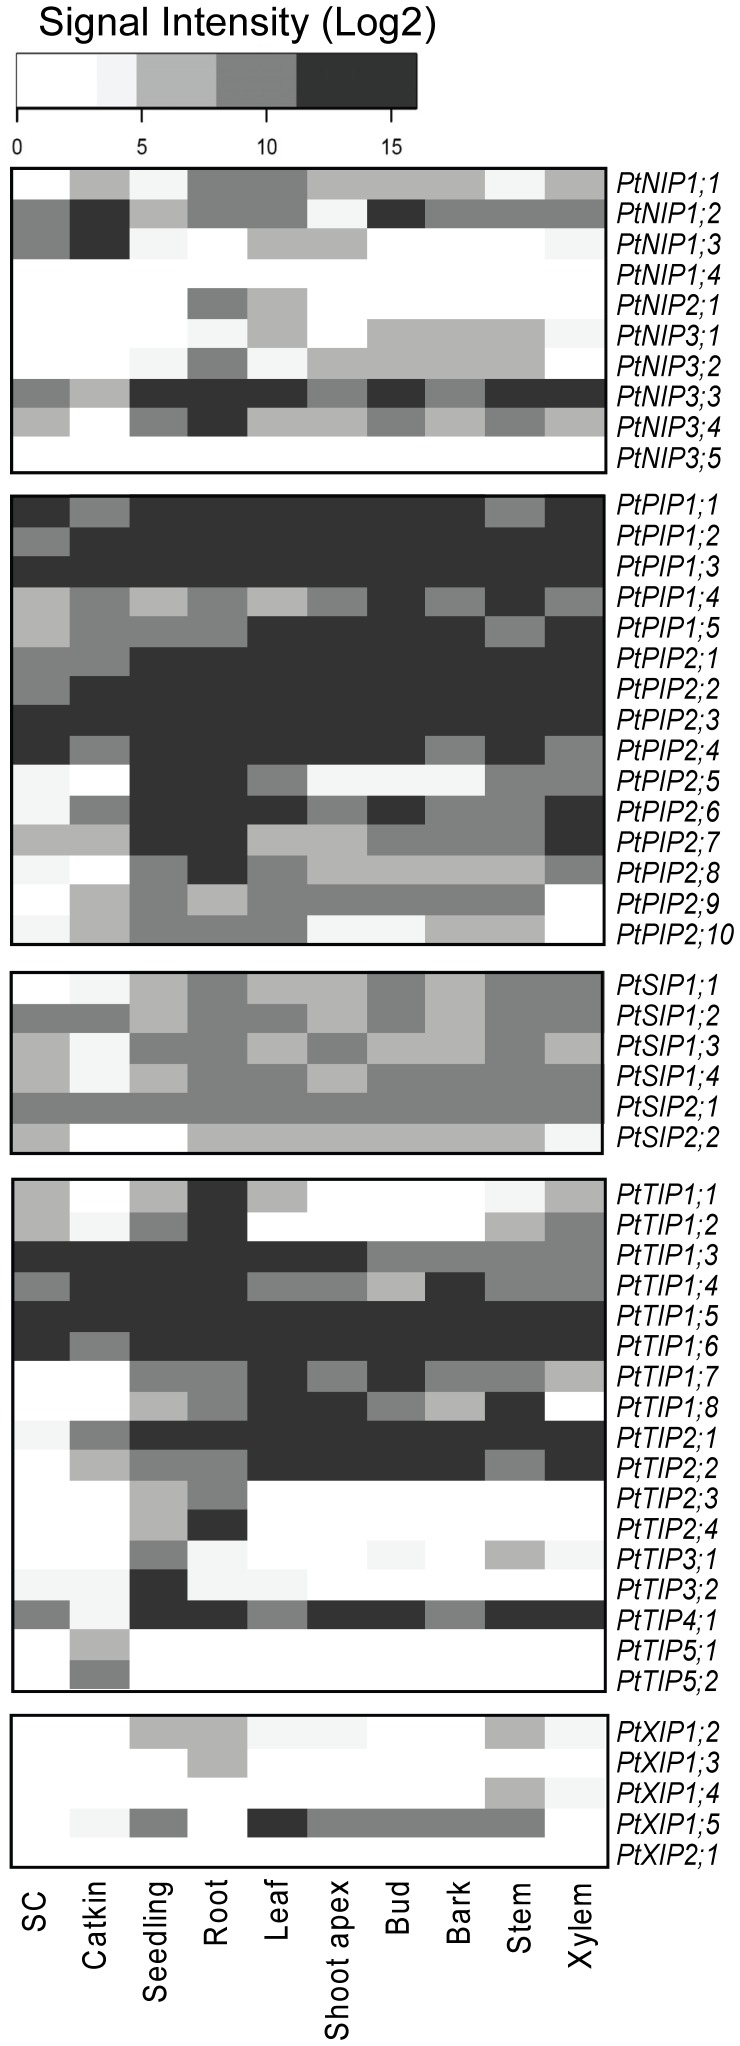
Figure 2. Expression profiles of AQP genes across tissues.
Expression domains were computed from 110 “control” arrays (i.e. without “treatment” and “transgenic line” data). Arrays were normalised with GcRMA within each experiment. Each row of the heatmap corresponds to an AQP member. Color scale depicts maximal Log2 expression level. White represents below background level. Columns correspond to the eight sample types, namely SC for suspension cells (2 arrays: GSE16773, GSE17804), catkin (2 arrays: GSE13990), seedling (3 arrays: GSE13990), root (15 arrays: E-MEXP-1874, E-MEXP-2234, GSE13109, GSE13990, GSE16888, GSE16785, GSE17223, GSE17225, GSE19297), leaf (56 arrays: E-MEXP-1928, GSE9673, GSE13109, GSE13990, GSE14515, GSE14893, GSE15242, GSE16417, GSE16783, GSE16785, GSE17226, GSE17230, GSE21171, GSE24349, GSE27693, GSE16417), shoot apex (2 arrays: GSE16495, GSE21061), bud (14 arrays: GSE29335, GSE29336, GSE30320, GSE24349) bark (1 array: GSE29303), stem (4 arrays: GSE21480, GSE12152, GSE19467) and xylem (11 arrays: E-MEXP-2031, GSE13990, GSE16459, GSE20061, GSE27063, GSE3232). The number of arrays per tissue and the series accession numbers are given into brackets.

