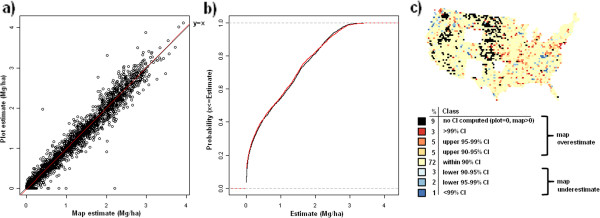
Figure 16.

Scatterplot, (a), cumulative distribution, (b), and map of confidence intervals of differences (c), between map-based and plot-based estimates of understory aboveground and belowground carbon. Results are based on C density at the spatial scale of 50 km (216,500 ha hexagons).
