
Figure 5.
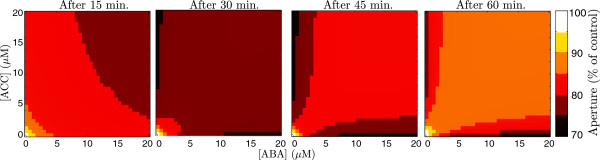
Map of model responses to treatment combinations. Predicted aperture response map of combinations of ABA and ACC doses 15, 30, 45, and 60 minutes after treatment. The coordinates of each point in represent the dose combination and the colour denotes the response. Dark regions indicate less aperture (i.e., more closure in response to treatment) and lighter regions show more aperture. Response apertures shown as percent of control.