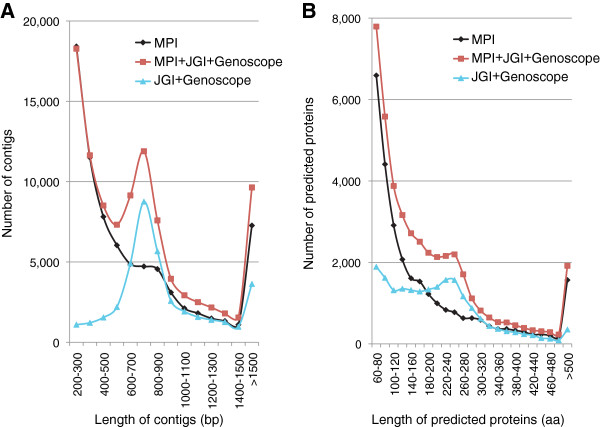
Figure 1.
Size distribution of cDNA contigs and predicted protein sequences in three A. pompejana datasets. (A) Histograms representing the number of contigs in the different size-ranges for the MPI (black), MPI + JGI + Genoscope (red) and JGI + Genoscope (cyan) assemblies. (B) Histograms representing the number of predicted proteins in the different size-ranges for the MPI (black), MPI + JGI + Genoscope (red) and JGI + Genoscope (cyan) datasets.

