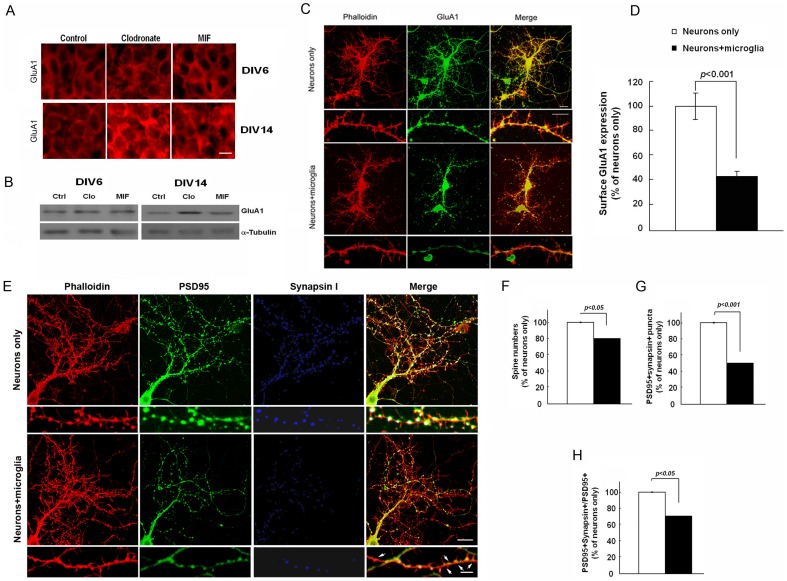
Figure 6. Microglia alter synaptic density and GluA1 expression in hippocampal neurons.
A, B. Hippocampal slices were treated with clodronate (5 µg/ml) or MIF (100 µg/ml) for 6 or 14 DIV. A, GluA1 expression in the CA1 neuronal layer in DIV6 and DIV14 hippocampal organotypic brain slices. B, Lysates from the organotypic slices were immunoblotted and probed using antibodies against GluA1 and α-tubulin. Scale bar, 10 µm. C, D. Primary WT hippocampal neuronal cultures were cultured in the absence or presence of microglia for 2 days. C, Immunohistochemistry was performed using anti-GluA1 antibody under non-permeabilized staining conditions and visualized with Alexa Fluor488-conjugated secondary antibody. After subsequent permeabilization phalloidin was used to stain F-actin. Scale bar, 20 µm. D, Quantitative analysis of surface GluA1 along dendrites for neurons with or without microglia using the LSM 5 Image Browser (Zeiss). Data are presented as mean ±SEM and expressed as a percent of the neurons-only control sample. E–H. E, Hippocampal neurons with or without microglia were stained with PSD95 (green), synapsin I (blue), and phalloidin (red). The smaller boxes show magnified images. Arrows depict PSD95+ synapsin I− puncta. Scale bars, 20 µm (upper panel); 5 µm (lower panel). Quantification of spine numbers (F), PSD95+ synapsin I+ puncta (G), and PSD95+synapsin I+ puncta in total PSD95+ puncta (H) in neurons cultured with or without microglia. Values are presented as mean ±SEM expressed as a percent of the neurons-only control sample.

