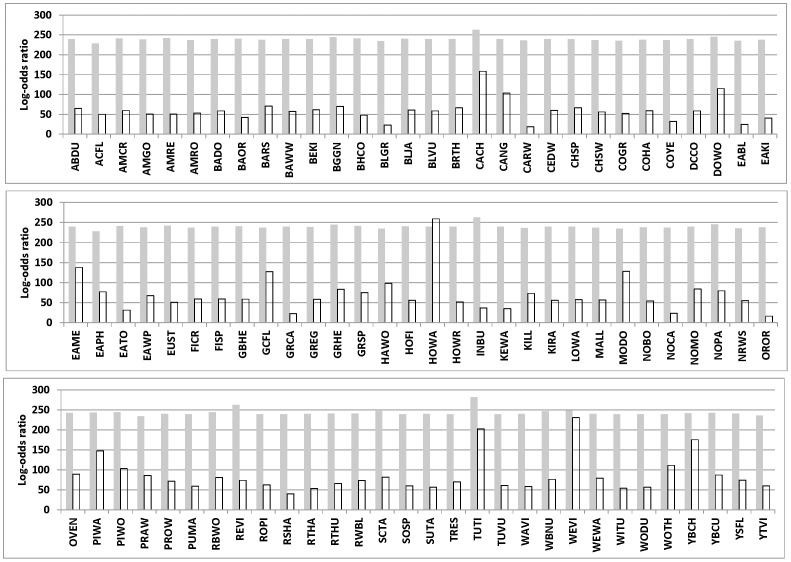
Figure 3. Strength of autocorrelation for individual species across the bird community at Patuxent National Wildlife Refuge.
Gray bars represent a reduced model with only spatial effects included; unfilled bars represent a global model with landcover and spatial effects included. Bar heights represent means from the posterior distribution of a Bayesian analysis based on three independent MCMC chains (n = 20,000). All of the Bayesian credibility intervals overlapped and are not shown for clarity.

