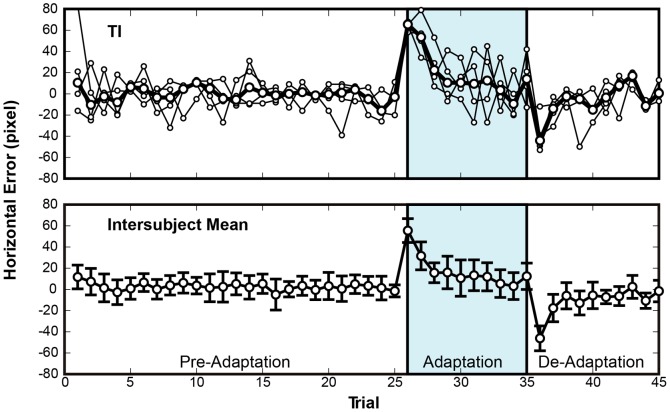
Figure 2. Adaptation curve from Experiment 1, 0-ms condition.
The horizontal error is plotted against the sequence of trials. The upper and lower panels show the data for one typical subject (TI) and the average for all subjects, respectively. In the upper panel, the thin lines represent the results for four individual sessions and the bold line represents their median. Although inter-session variability was rather large, the median shows a typical adaptation curve. In the lower panel, the bold line shows the averages for all subjects, and the error bars show the standard deviation. The averaged learning curve is a classic adaptation curve.

