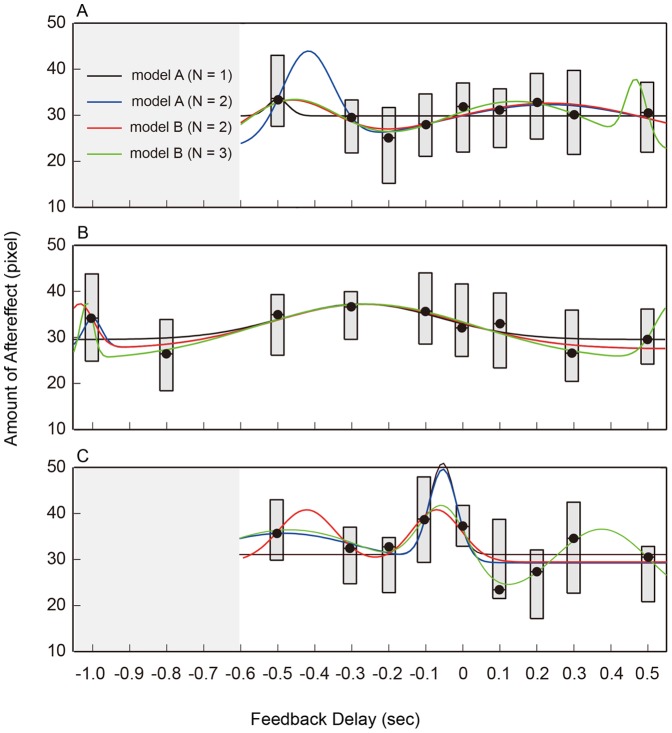
Figure 3. Experimental Results.
The estimated aftereffect (Ad: see Materials and Methods) is plotted against the delay conditions. The box plot shows the quartiles: thick segments indicate the medians, and the top and bottom of the boxes show the 25th and 75th percentiles. Line plots are the curves fitted using four different radial basis functions. A: Cursor movement time (cMT) was 600 ms and no timing cue was presented (Expt. 1), B: cMT was 1100 ms and no timing cue was presented (Expt. 2). C: cMT was 600 ms and the timing cue was presented (Expt. 3). In each case, radial basis curves with two basis functions seem to best fit the experimental result, implying that the relationship between the feedback delay and aftereffect had two peaks.

