
Figure 4. Results of Supplementary Experiment.
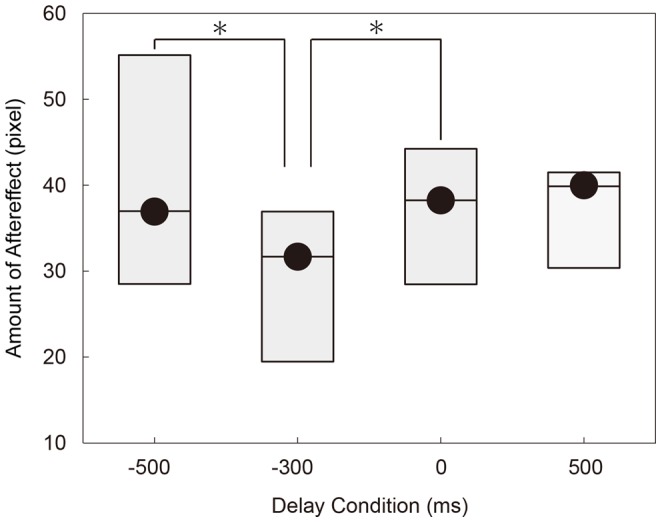
The estimated aftereffect (Ad: see Materials and Methods) is plotted for four delay conditions. The box plot shows the quartiles: thick segments indicate the medians, and the top and bottom of the boxes show the 25th and 75th percentiles. Asterisks indicate significant difference (p < 0.05) detected by a post-hoc multiple comparison test (Scheffe’s method). The amount of after effect was significantly larger when the feedback was given 100 ms after the movement offset and at the task end, compared to the case that it was given 300 ms before the task end.