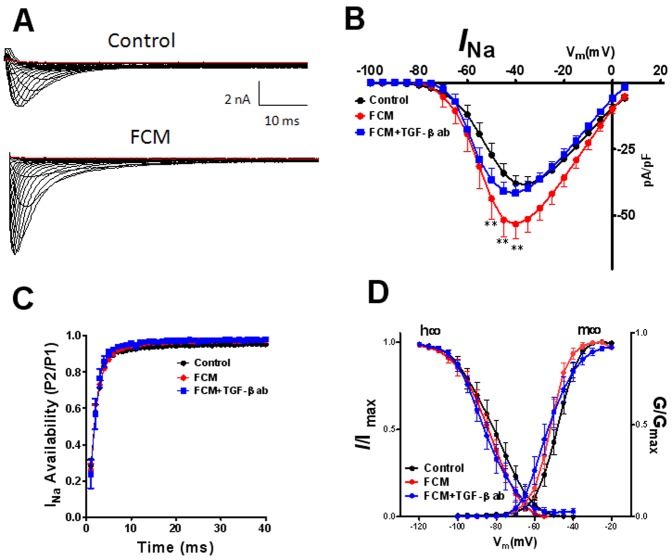
Figure 1. Effects of fibroblast conditioned medium (FCM) on peak inward sodium current (INa) after 72 hr of treatment.
Representative current traces A) Top Panel, control; Lower Panel, FCM. Current-voltage relationships for control (black), FCM (red) and FCM+TGF-β1 antibody (TGF-β1 ab) (blue) is shown in panel B. C) Time dependent recovery of the channel. D) Voltage dependence of inactivation (h∞ curve) and Voltage dependence of activation (m∞ curve). Values are mean ± standard error of the mean N = 13−29 cells from 7 different isolations. **indicates p<0.01 significant difference between control and FCM treated cells by two way ANOVA with Bonferroni post-test.

