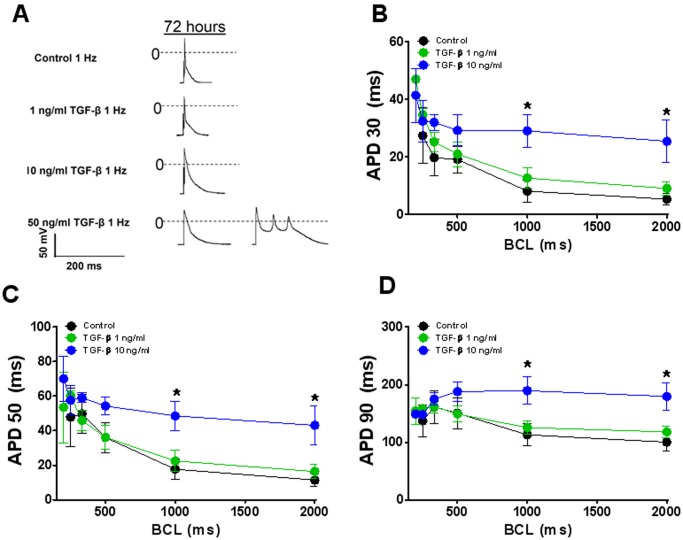
Figure 6. Effects of TGF-β1 on the action potential duration (APD) of ventricular myocytes at 72 hours.
A) representative APs in control and TGF-β1 (1–50 ng/ml at BCL = 1000 ms. B-D), Cycle length dependent changes in APD30, APD50, APD90 in control (black), TGF-β1 1 ng/ml (green) and TGF-β1 10 ng/ml (blue). Values are mean ± SE. N = 6−8 cells in each group. From 3 different isolations.*indicates p<0.05, significant difference between control and TGF-b1 treated cells.

