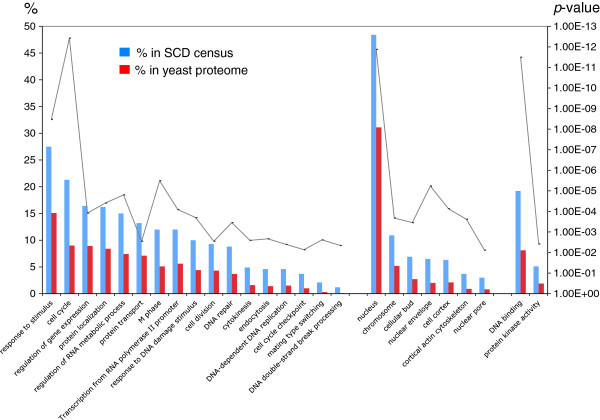
Figure 2.
Gene Ontology terms enriched in the S. cerevisiae SCD census. A bar graph showing the percentage of SCD proteins significantly associated with Gene Ontology , processes (left), components (center) and functions term (right) as compared to the percentages of all yeast proteins (red bars) having the same associations. The significant p-values (p < 0.05) are shown as a line graph, its axis on the right.

