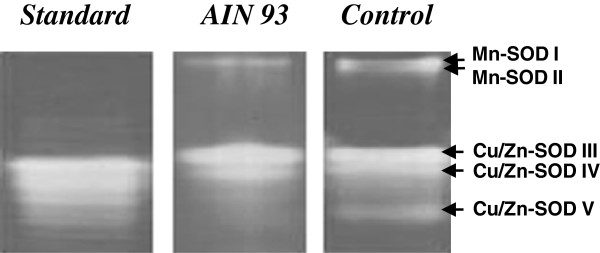
Figure 2.

SOD isoforms of male Swiss mice fed on two different diets. Electrophoresis was performed as described in Materials and Methods. The gel was placed in a dark box with dye solution for 30 min. After incubation, the gel was illuminated and kept in water until the development of colorless bands of SOD activity in a purple-stained gel was visible. The picture illustrates the identification of SOD isoforms in the livers of mice fed with a AIN 93 or commercial diet. Five predominant SOD isoforms were identified in the liver of commercial diet fed animals, whereas only SOD isoforms I, III and IV were clearly visible in AIN 93 diet fed animals.
