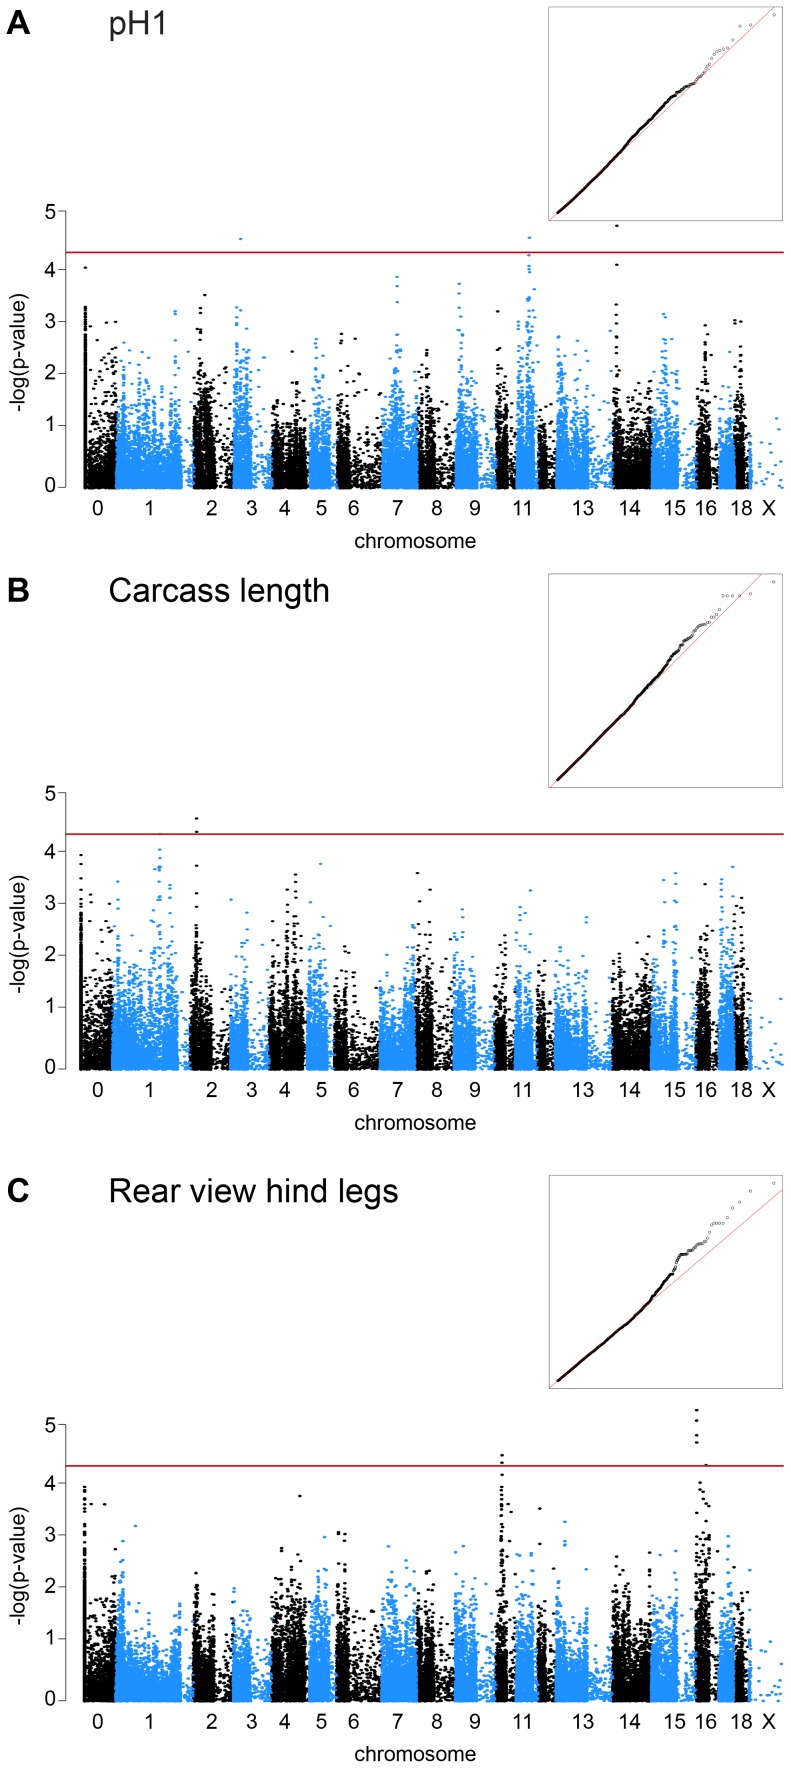
Figure 1. Manhattan plots of genome-wide association studies for EBVs of commercially important traits in pigs.
The red lines indicate the significance threshold for moderately significant associations (p = 5×10⁻⁵). “Chromosome 0” harbors SNP markers that have not yet been mapped to the pig reference genome. The inserted quantile-quantile (QQ) plots show the observed versus expected log p-values. The straight line in the QQ plots indicates the distribution of SNP markers under the null hypothesis and the skew at the right edge indicate that these markers are stronger associated with the traits than it would be expected by chance. Please note that in Figure 1A there are appear to be associated SNPs on SSC 3, 11, and 14. The two associated SNPs on SSC 3 and 11 mapped to these chromosomes in the Sscrofa 9.2 assembly, but are no longer placed on any chromosome in the Sscrofa 10.2 assembly.

