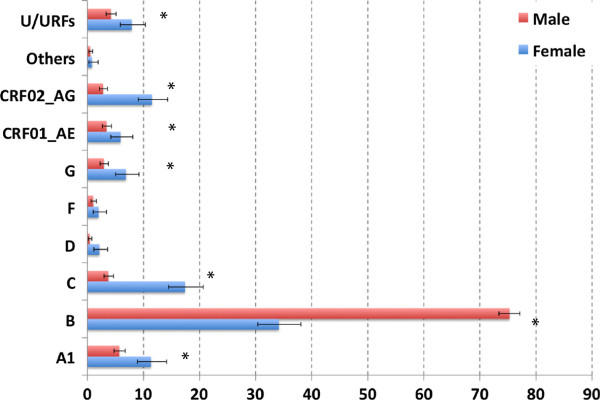
Figure 3.

Subtype distribution by gender. A total of 307 females (blue bars) and 989 males (red bars) were included in the analysis. For 4 patients, this information was not available; and these were deleted from the data set. Asterisks indicate statistically significant differences in the proportion of a certain subtype in male vs. female (p<0.05).
