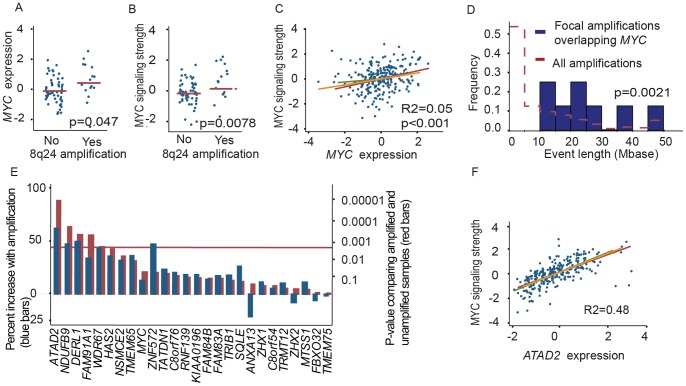
Figure 1. MYC, ATAD2 and 8q24 associations.
(a) MYC expression and (b) MYC signaling are both increased among endometrial cancers with 8q24 amplification. (c) Variations in MYC expression only explain a small proportion of the variation in MYC signaling. Linear fits are shown in red, yellow, and green for the primary investigation series, internal validation series, and external validation series, respectively. (d) The lengths of the amplifications that contain MYC are significantly larger than expected compared to amplifications observed elsewhere in these cancers. (e) Among 26 genes in the 8q24 peak with corresponding expression data, expression of ATAD2 is most strongly and significantly associated with amplification. Blue bars show the percent increase in gene expression and red bars show the p-values. The significance threshold is Bonferroni-corrected for multiple hypotheses. (f) Expression of ATAD2 is highly correlated with MYC signaling strength. Linear fits are shown as in panel c.

