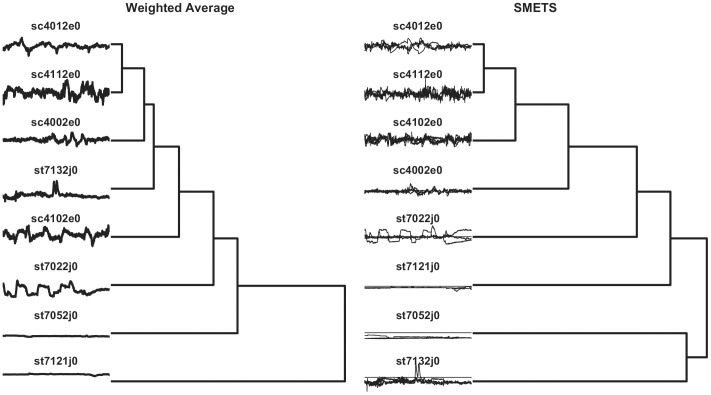
Figure 10. Hierarchical clustering of modified electrophysiological sleep data.
Distances were measured using the weighted average method versus SMETS. The dendrogram reveals the relative distances between each entity. The time series considered by each method are represented to the left. All time series have only 5 dimensions, by removing the two extra dimensions from series sc4012e0, sc4112e0, sc4102e0 and sc4002e0 (see Results section for details).

