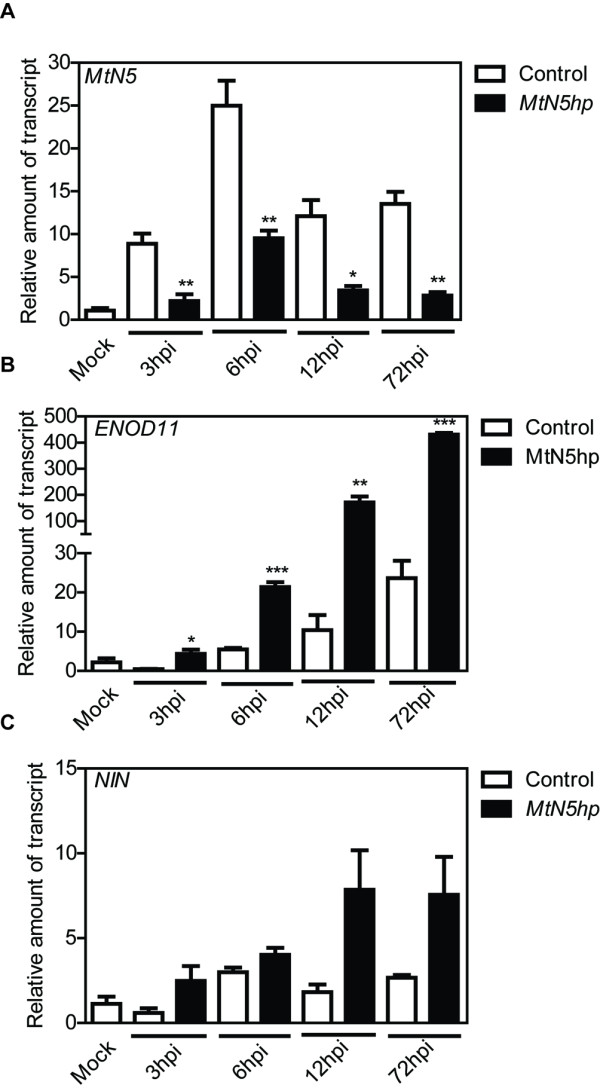
Figure 3.

Time course expression analysis of MtN5, ENOD11 and NIN genes after rhizobial inoculation. The expression level of MtN5 (A), ENOD11 (B) and NIN (C) was assessed by qRT-PCR in adventitious hairy roots obtained by genetic transformation with A. rhizogenes harbouring a pRedRoot binary vector carrying either the MtN5hp construct or an empty T-DNA. The data were normalized to an internal actin control. The relative expression ratios were calculated using control mock-inoculated roots as calibrator sample. The values reported are means ± SE (n=at least 3). Student’s t test was applied. *, P < 0.05; **, P < 0.01; ***, P < 0.001.
