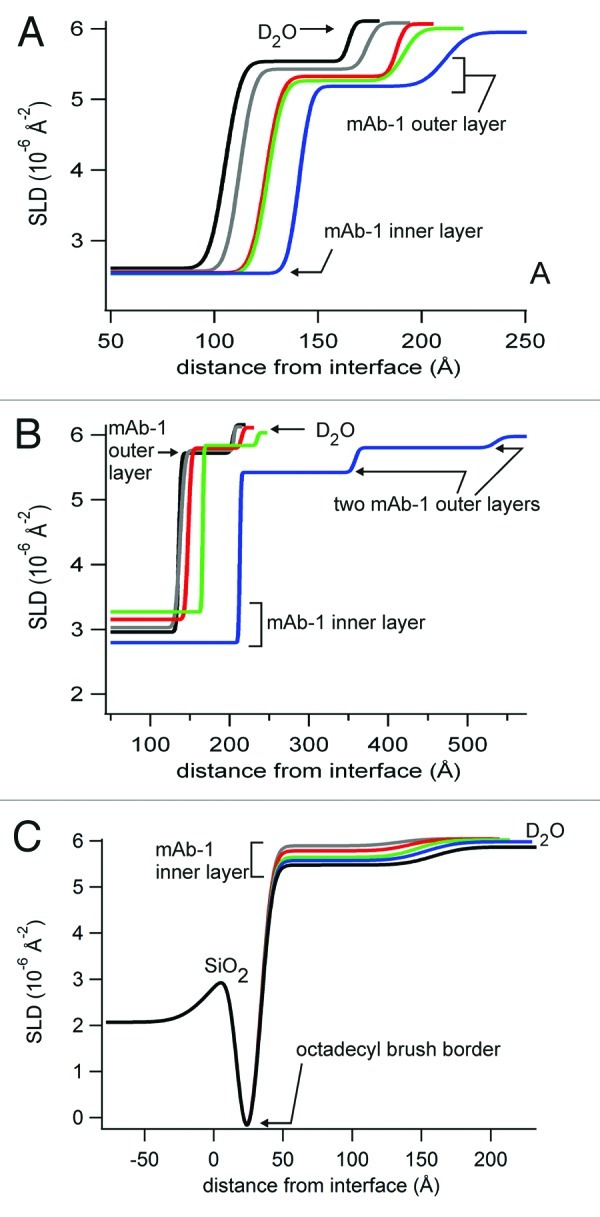
Figure 10. Fitted SLD profiles for neutron reflectivity data for mAb-1 adsorbed to SiO2 from solutions in histidine pH 5.5 (A) or PBS pH 7.4 (B), and to OTS-coated SiO2 from solutions in histidine pH 5.5 (C). Profiles are shown as the distance from the silicon-SiO2 interface and labels are used as a guide for the SLD of each layer, corresponding to Table 1.
