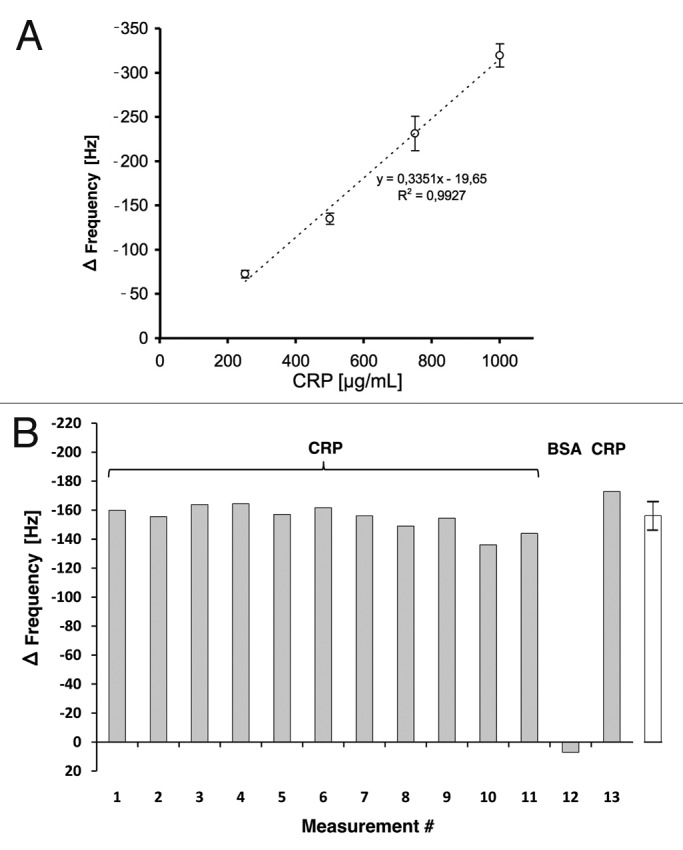
Figure 9. (A) Calibration of the scFv LA13-IIE3 QCM sensor. Measurements disturbed by air bubble peaks were excluded from the calculation of the linear regression equation (dotted line). Correlation coefficient R2 is indicated. Error bars represent standard deviations from triplicate measurements. (B) Repeated measurements to validate reproducibility of CRP specific frequency drops measured with the scFv LA13-IIE3 QCM immunosensor. A total of 12 injections of 0.5 mg/mL CRP and one injection of BSA (#12) used as negative control were applied to the same sensor chip using constant flow rate of 34 µL/min. Sensor frequency was measured every 83 ms. The maximum frequency change before and during CRP or BSA injection is shown. The right (white) bar represents the average frequency shift and standard deviation of all CRP measurements (#1–11 and #13).
