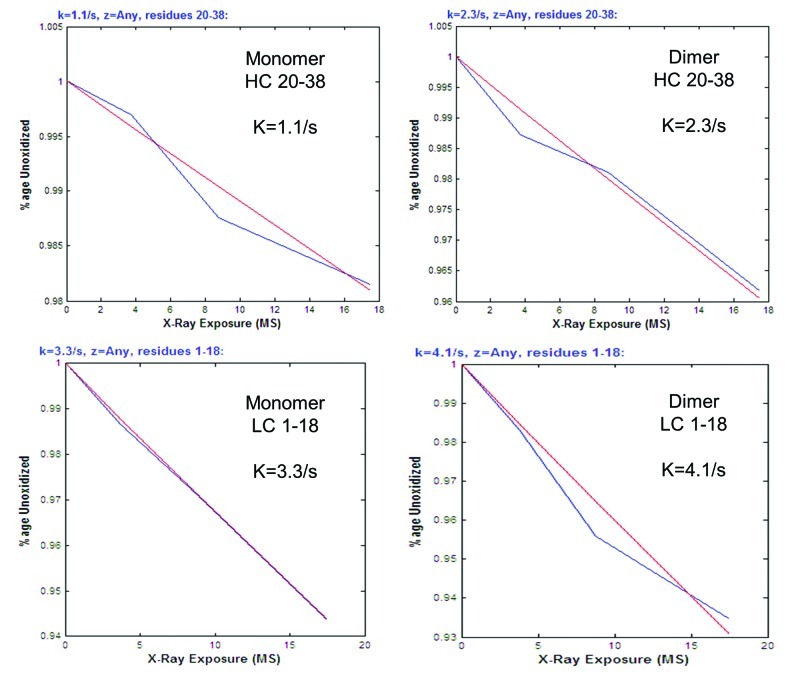
Figure 4. Examples of dose response curves and rate constants for oxidized tryptic peptides. Data generated by ProtMap MS software. Linear curves reflect the pseudo first order reaction kinetics of the hydroxyl radical oxidation. Rate constants (k) are also calculated by the software. Blue lines are point-to-point plots of the rate constants (k) at each exposure time. Red lines represent the lines of best fit.

An official website of the United States government
Here's how you know
Official websites use .gov
A
.gov website belongs to an official
government organization in the United States.
Secure .gov websites use HTTPS
A lock (
) or https:// means you've safely
connected to the .gov website. Share sensitive
information only on official, secure websites.
