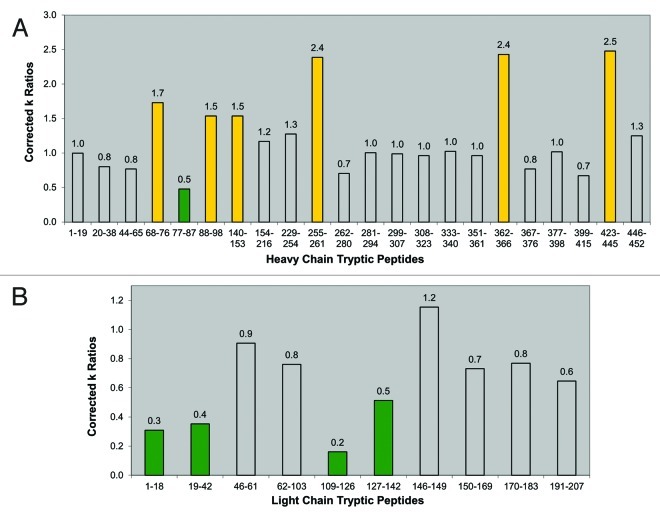
Figure 5. Bar graphs of corrected rate constant ratios (dimer:monomer). (A) Corrected rate constant (k) ratios of heavy chain tryptic peptides (Table 4A). (B) Corrected rate constant (k) ratios of light chain tryptic peptides (Table 4B). For both panels, yellow bars indicate peptides with decreased protection in the dimer. Green bars indicate peptides with increased protection in the dimer. Uncolored bars indicate peptides that show no relative difference in protection levels between the dimer and monomer.

An official website of the United States government
Here's how you know
Official websites use .gov
A
.gov website belongs to an official
government organization in the United States.
Secure .gov websites use HTTPS
A lock (
) or https:// means you've safely
connected to the .gov website. Share sensitive
information only on official, secure websites.
