
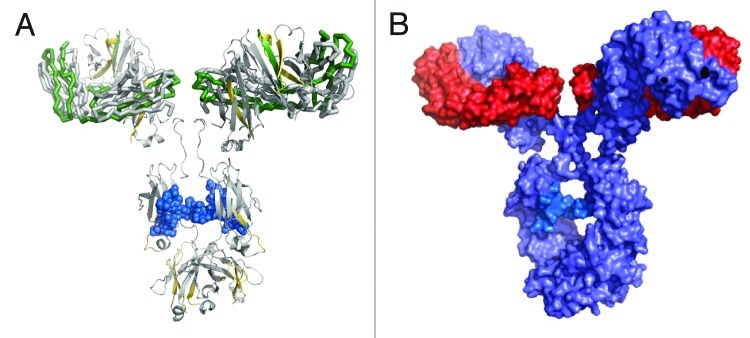
Figure 6. IgG1 homology structure with mapped protection levels. (A) Model of IgG1 constructed using 1BJ1 and 1IGY crystal structures. Colored according to the relative protection levels derived from oxidative labeling. Yellow indicates regions with decreased protection in the dimer. Green indicates regions with increased protection in the dimer. Uncolored areas indicate regions which show no relative difference in protection levels between the dimer and monomer. The blue region represents the Asn-linked Fc glycans typically found in IgG1 therapeutic mAbs. (B) Space-filled cartoon model of the IgG1 with the heavy chains colored purple and light chains colored red. The light chains of an IgG1 are on opposite planes with respect with each other. The heavy chains in the Fab region are also on opposite planes.