
Figure 3. Plasma LPS levels and inflammation markers after chronic CB receptor agonist treatment or LPS treatment.
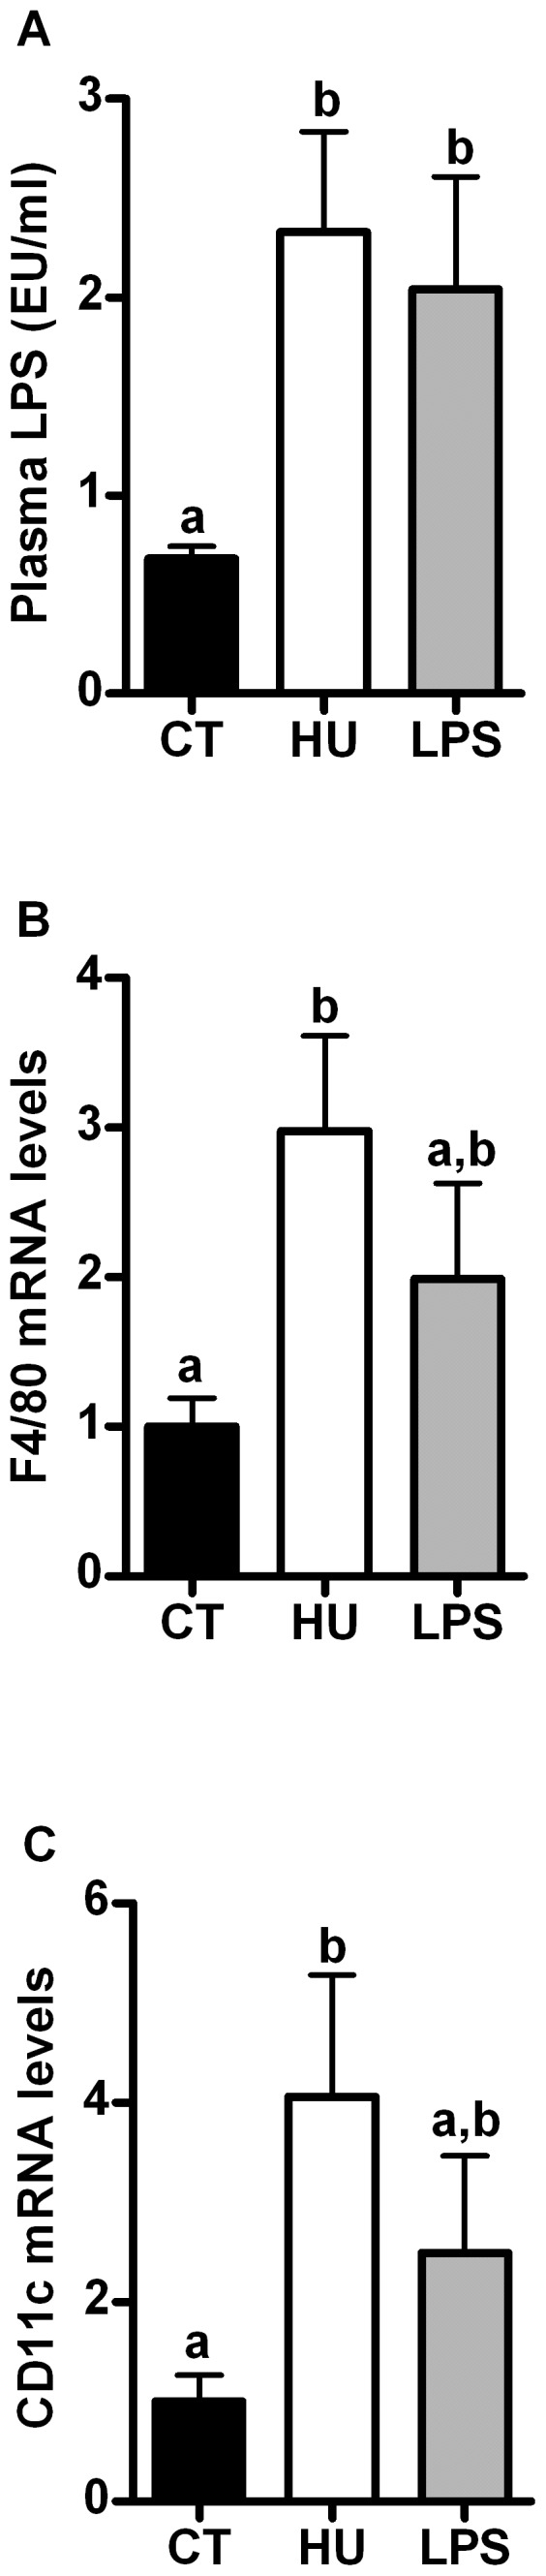
(A) Plasma LPS levels; (B) F4/80 mRNA levels in the tibialis anterior muscle; (C) CD11c mRNA levels in the tibialis anterior muscle. All results are expressed as the means±SEM for 7–9 mice per group from the HU-treated group (HU) and the LPS-treated group (LPS) compared with the levels in the control group (CT). The data with different superscripted letters are significantly different based on a one-way ANOVA followed by the Bonferroni post hoc test.