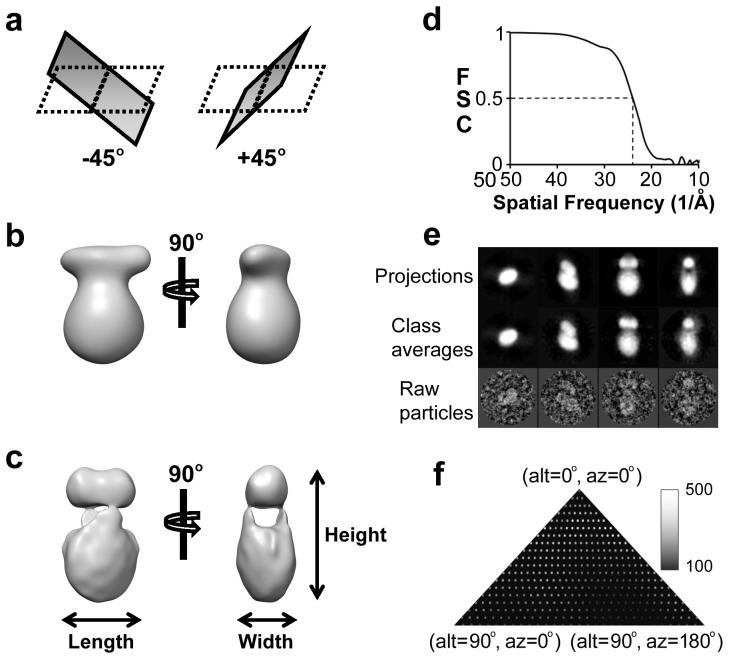
Figure 2. Single-particle reconstruction of bovine AE1.
(a) Schematic illustration of the OTR data collection method. For each target sample area, two micrographs were recorded with the grid tilted at −45° and +45°, respectively. (b) 3D map generated by averaging 25 OTR maps. Two orthogonal views, defined as front view (left panel) and side view (right panel), are shown. (c) Final map obtained by merging 174,197 particle images with single particle reconstruction method. The map in (c) is shown in the same orientations as in (b). (d) Fourier shell correlation (FSC) coefficient between two reconstructions obtained from even- and odd-numbered particle images. The effective resolution is estimated to be 2.4 nm using the 0.5 FSC cut-off. (e) Comparisons of the computed projection, class average, and raw particle. Four representative views (top, tilt, front, and side) are show from left to right, respectively. (f) Euler angle distribution of classified particles. The brightness of each point indicates the number of particles used in the class average in that orientation.

