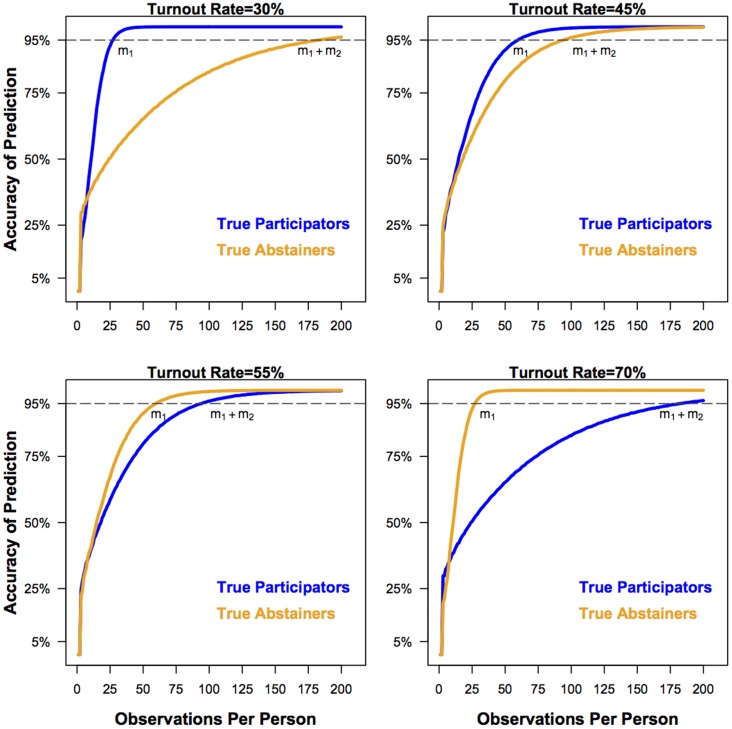
Figure 2. The proportion of correct predictions for participation rates of 30%, 45%, 55%, and 70% (the match rate is held constant at 30% in all four figures) from a simulation of the matching procedure.
The dark line represents the accuracy rate for true participators. The light line represents the accuracy rate for true abstainers. Accuracy increases for both categories as observations for each individual are obtained from the Yahtzee procedure. Note that the less frequent of the two behaviors requires fewer observations for classification than the more frequent behavior.  is the number of observations per person necessary to achieve a given level of accuracy for the less frequent behavior and
  is the number of observations necessary to achieve a given level of accuracy for the more frequent behavior.

