
Figure 4. The proportion of Facebook users that were matched to the validated voting record by age and each age group's proportion of the largest age group (those 20 years of age at the time of the election).
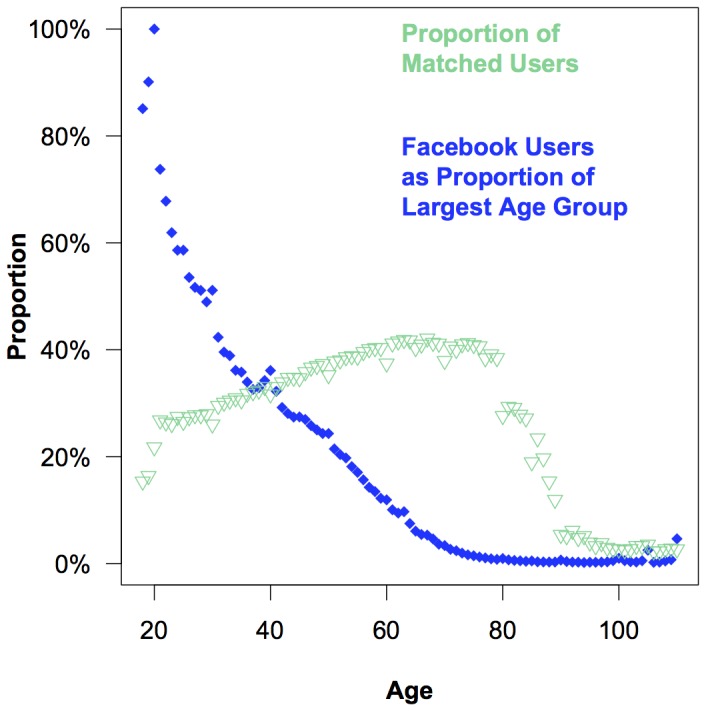
This figure helps to explain why match rates are lower for Facebook users who tend to be younger and more difficult to match than the average registered voter.