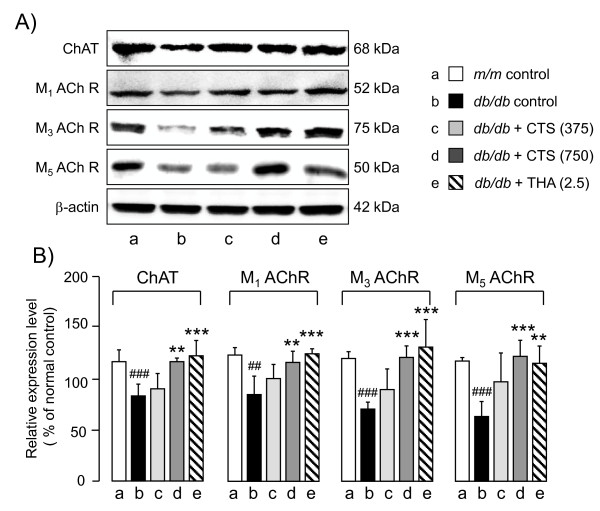
Figure 9.
Effects of CTS and THA on ChAT, M1, M3,and M5receptor protein expression in the hippocampus of db/db mouse. Typical photos indicating the expression levels of each factor in the hippocampus of vehicle-treated m/m (lane a), and vehicle (lane b)-, CTS (325 mg/kg per day: lane c; 750 mg/kg per day: lane d)-, and THA (2.5 mg/kg per day; lane e)-treated db/db mice. B) Quantitative comparisons of each factor among different animal groups were conducted as described in the text. The data are expressed as the percentage of the value obtained from naïve control m/m mice. Each data column represents the mean ± S.D. obtained from 5-6 brain samples. ##P < 0.01, ###P < 0.01 vs. vehicle-treated m/m group (Student’s t-test). **P < 0.01, ***P < 0.001 vs. respective vehicle-treated db/db group (one-way ANOVA followed by Tukey test).

