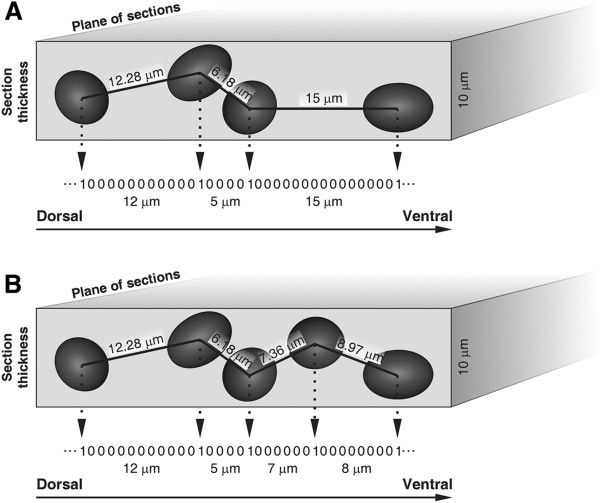
Figure 13.
Schematic representation of mitotic neuroepithelial cells intercalation among adjacent mNECs. Schematic representation of a planar view of the ILM where “x” represents the D-V axis and “y” corresponds to the section thickness. Binary signals correspond to the projection of the distance of adjacent mNEcs over the ILM area.

