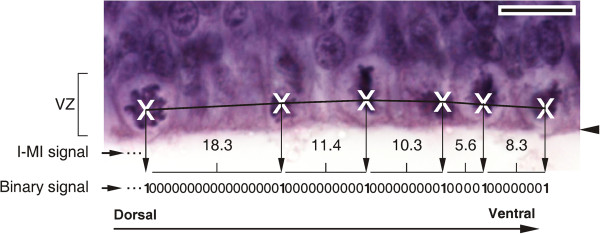
Figure 14.

Mitotic neuroepithelial cell recording and signal generation. Image of the OT ventricular zone illustrating a segment of the mNEc-R (white crosses). Corresponding subseries of the I-MI signal (Euclidian distances between successive mitosis) and of the binary signal (sequence of “1 s” and “0 s”) derived from the mNEc-R are also shown. The Arabic numbers between successive crosses indicates the I-MI length expressed in μm. The vertical arrows indicate the spatial correlation between the mNEcs positions and the positions of “1 s” in the binary signal. The horizontal lines between successive arrows indicate the distance (number of “0 s” + 1) between successive “1 s” of the binary signal. Horizontal arrowhead: ILM. VZ: ventricular zone. Bar: 10 μm.
