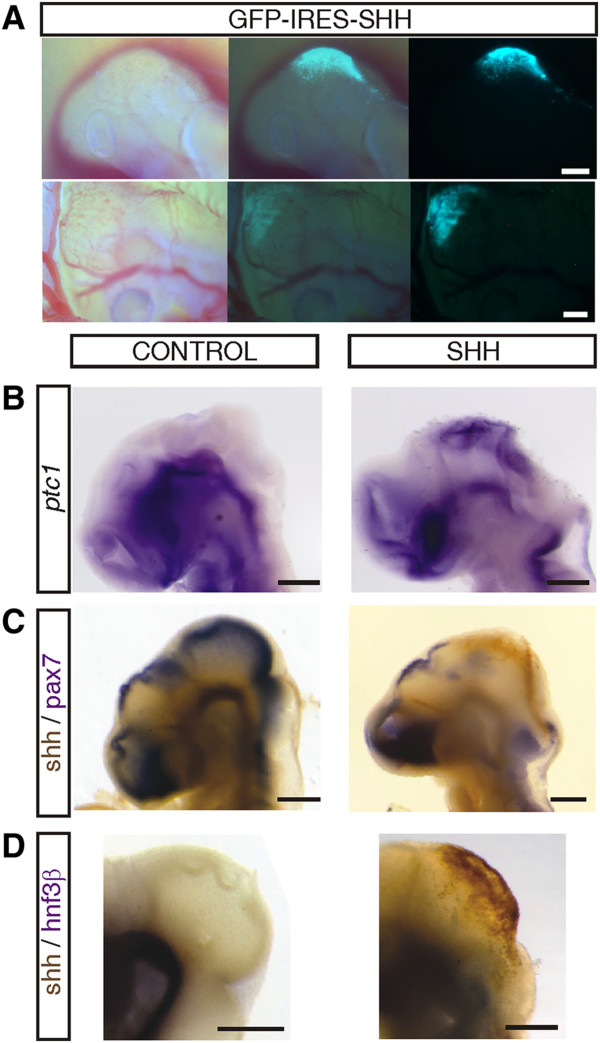
Figure 2.
Results of electroporation. A. Left lateral view of the cephalic region of Stg 17 (upper panel) and Stg 21 (bottom panel) embryos electroporated at Stg 11. Patches of GFP+ areas are observed over the DMB surface. Bars: 100 μm. B. In situ hybridization for detection of ptc1 expression. In the control embryo ptc1 expression is restricted to the ventral neural tube. In the Shh electroporated embryo ectopic ptc1 expression is observed in the dorsal midbrain. Bar: 100 μm. C. Double staining for Shh and Pax7. Control embryo display Shh immunoreactivity in the basal midbrain and Pax7 reactivity in the dorsal midbrain. The dorsal midbrain of the Shh electroporated embryo displays ectopic expression of Shh and downregulation of Pax7. D. Double staining for Shh and Hnf3β. In control specimens the ventral marker Hnf3β, typically stain the basal midbrain. In the Shh electroporated embryo the area of Shh misexpression is restricted to the dorsal; the domain of Hnf3β expression expanded laterally into a region that normally corresponds to the OT.

