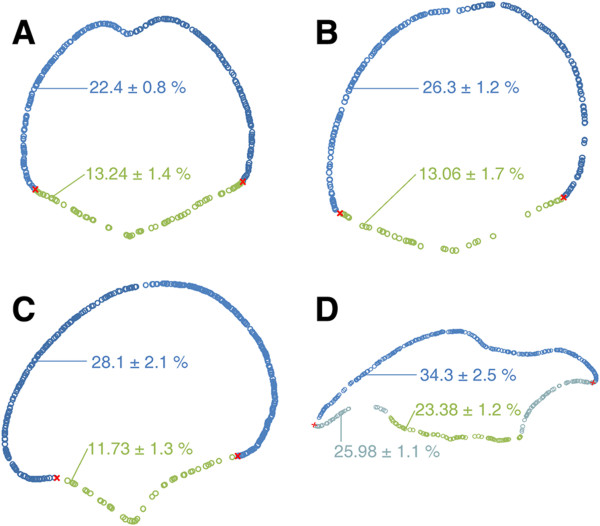
Figure 6.
Two dimensional representations of mNEc records. A. Control. B. GliA electroporated. C. Shh electroporated, non-ventralized. D. Shh electroporated, partially ventralized. The position of each circle is specified by the spatial co-ordinates of each mNEc. Blue circles: mNEcs located along the alar plate. Green circles: mNEcs located along the ventral midbrain. Light-blue circles: mNEcs located along the ventralized region of the dorsal midline. The percentage (mean ± SD) of the ILM area occupied by mNEcs is indicated in each case. There are statistically significant differences (p<0.03) between control (A) vs. GliA (B) and Shh (C and D). The ventralized region of the dorsal midbrain and the ventral midbrain of partially ventralized dorsal midbrains (D) statistically differs from the other specimens (p<0.001).

