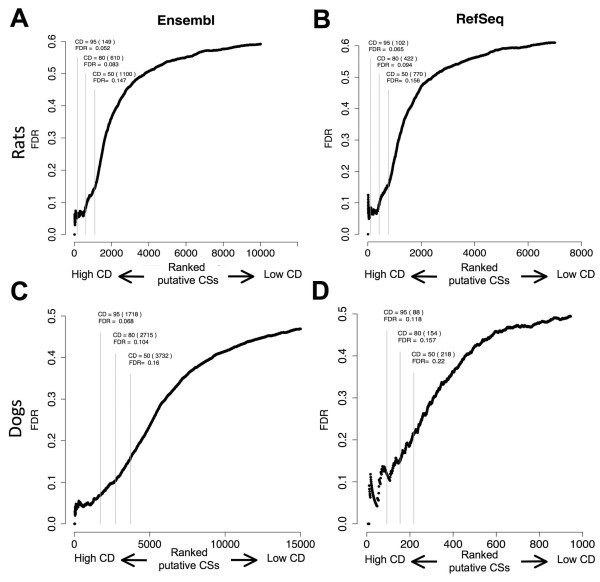
Figure 5.
Identification of PASs in rats and dogs using orthologous transcripts and total RNA sequencing data. FDR values calculated using each of the putative PASs CD as a cutoff are shown as in Figure 4. The putative PASs were obtained using the Ensembl (Panels A and C) and RefSeq (Panels B and D) databases from rats (Panels A and B) and dogs (Panels C and D).

