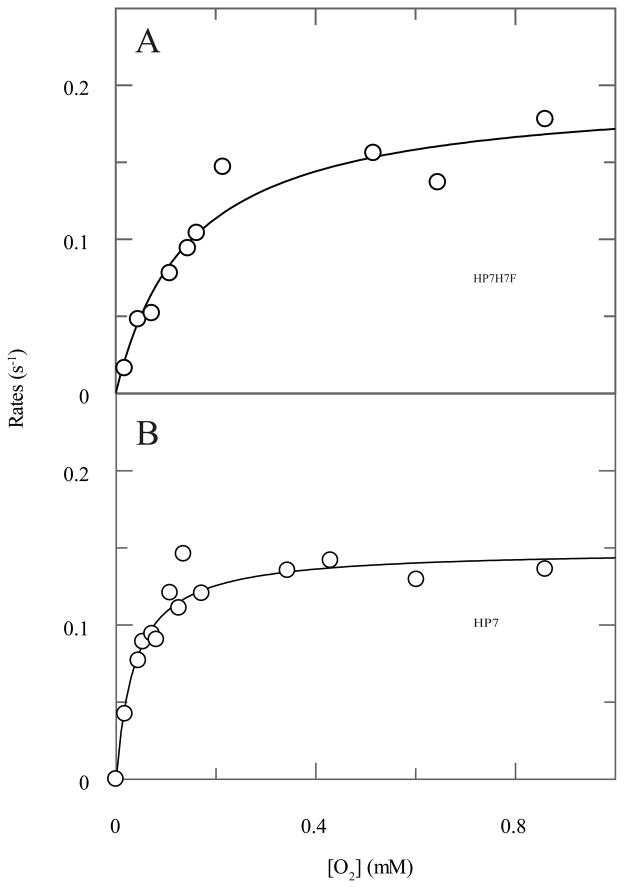
Figure 3.
Rates of oxyferrous state breakdown at both heme binding sites in HP7. Reduced protein (20 μM), prepared by carefully titrating with a slight excess of dithionite, was mixed with oxygen in a stopped-flow and the rate of protein oxidation followed spectroscopically. Lines drawn are fits with equation 3. (A) Oxygen concentration dependence of the loop end site in HP7-H7F. (B) Oxygen concentration dependence of the open end site in HP7 with one heme bound.

