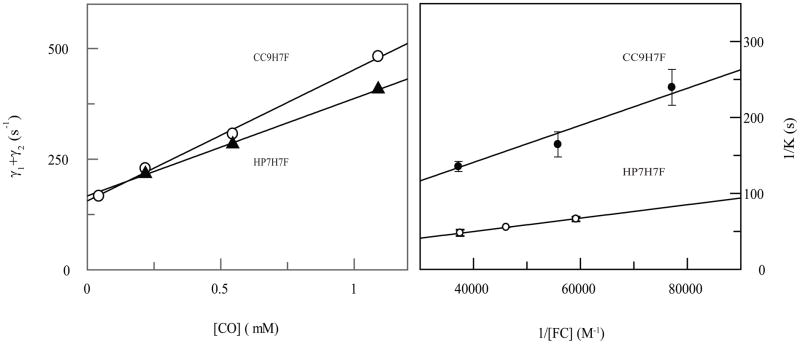
Figure 4.
Rates of CO complex formation and dissociation in HP7-H7F and CC9-H7F. (A) Replots of laser flash photolysis data from reference 6 used to calculate the pentacoordinate CO binding rate constant, k+CO. It is derived from the slope of the CO concentration dependence using equation 5. Open circles – CC9-H7F, closed triangles – HP7-H7F. (B) Ferricyanide trapping analysis of CO release. Double reciprocal plots of the rates of oxidation vs. the concentration of ferricyanide extrapolated to infinite ferricyanide give the CO dissociation rate as shown in equation 4 (9).

