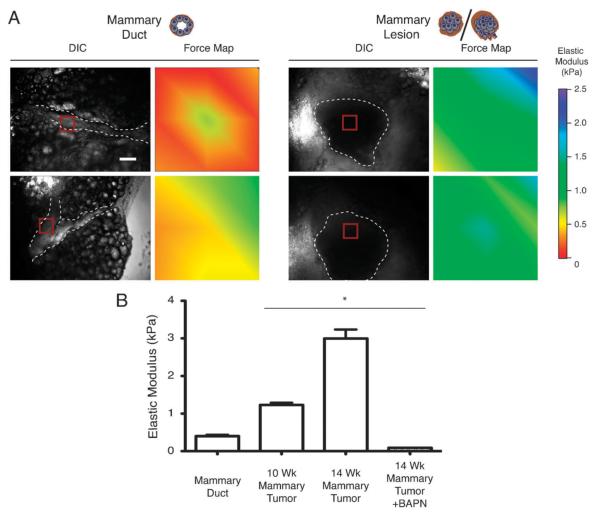
Fig. 1.
In situ biomechanical characterization reveals mammary tumors are stiffer than normal mammary ducts. (A) Representative DIC microscopy images showing mammary gland ducts (left column, dashed line) as compared to mammary lesions (right column, dashed line). AFM indentations were performed in 90 × 90 μm areas (red square) and the measurements obtained within this area are represented as a force heat map. Scale bar = 100 μm. (B) Bar graph demonstrating the average Young’s elastic modulus calculated from force map measurements (see A). Error bars represent average ± S.E.M. *P < 0.001. Graphs represent compiled measurements taken from at least 5 mice. Each force map is made up of 36 indentations.

