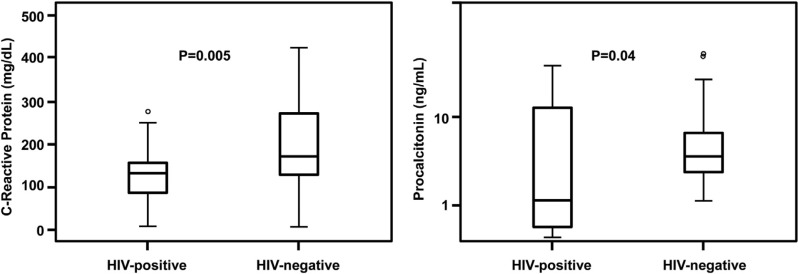
Figure 1.
Initial concentrations of C-reactive protein and procalcitonin in HIV-positive and HIV-negative septic patients. Box plot definitions: horizontal bars represent medians; boxes represent interquartile range (IQR); vertical bars represent values between upper and lower outlier limits; upper outlier limit=upper quartile +1.5×IQR; lower outlier limit=lower quartile −1.5×IQR; circles represent outliers. *Wilcoxon–Mann–Whitney test.

